IFLA

IFLA Section of Geography and Map Libraries


If you have any suggestions, comments or items that you would like to see added to this collection, please direct your messages to: libmap1@uconnvm.uconn.edu

Title

Digital Map Librarianship: Maps and Digital Spatial Data

Functions of the Paper Map

  • To represent the surface of the earth (See Figure 1 for an example of a topographic map)
  • To show spatial distributions (See Figure 2 for an example of a thematic map)
  • To provide information so that the map can be catalogued and users can evaluate whether or not the map is appropriate for their needs (See Figure 3 for an example)

Fig. 1.

Fig. 2.

Fig. 3.

In paper maps, the data storage and data display functions are combined. Paper maps store and display information in the same map sheet.

Features of the Paper Map

Scale -- describes the relationship between a unit of distance on the map and the corresponding distance on the surface of the earth. Scale is important because it affects the amount of detail that can be represented. Map scale is printed on paper maps in one or more of the following forms:
Verbal Scale "One cm to 2.5 km"
Good choice for easy interpretation by map user but poor choice if map will be enlarged or reduced
Graphical Scale
Good choice for easy interpreation and for print and video maps that may be enlarged or reduced
Ratio Scale 1:50,000
Good choice for easy map comparisons

Projection -- transforms locations on the three-dimensional surface of the earth to the two-dimensional surface of the map representation. Projection is important because accuracy in at least one spatial relationship (direction, area, shape) must be sacrificed when a dimension is lost.

Symbols -- provide information on the attributes of the mapped point, line, and area features that represent the surface of the earth and objects on it. Symbols are important because they affect how surface features and spatial patterns are recognized and perceived. Each symbol can be described based on six visual variables:


Point

Line

Area

Shape

Size

Texture

Orientation

Graytone Value

Hue

Functions of the Digital Map or Spatial Database

  • To store information on the locations of points, lines, and areas on the earth's surface
  • To store information on the attributes or characteristics of the points, lines, and areas
  • To store information in a format that provides visualization and mapping software systems with access to geographic and thematic data. Digital spatial data, unlike paper maps, cannot be "viewed" without computer hardware and software
  • To store information on the quality of the data (metadata) so that users can make intelligent decisions about whether the spatial database meets their needs

Representing the surface of the earth in the digital environment makes it possible to separate storage of geographic and attribute data (spatial database management) from display of geographic data (visualization and mapping).

Two Views of Spatial Data: Fields and Objects

Geographic data are spatial data obtained from observation and measurement of events referenced to their location on the earth's surface.

Some spatial data are variables that are continuously distributed over, on, or below the earth's surface (for example, precipitation, elevation, soils). We can visit every place on the surface and measure a value for these variables. These data are field data. Field data are obtained by defining a set of observation points and observing or taking measurements of the variable at these points. The data values everywhere are then modelled from the observations made at selected points.

Other spatial data are locations of objects that are not continuously distributed over the surface (for example, houses, rivers, waste disposal sites). Features of this type exist only at certain locations. These data are object data. Object data are obtained by defining the set of objects of interest and encoding their locations in an otherwise empty region.

Two Structures for Digital Spatial Data: Raster and Vector

There are two main approaches to modelling, digital spatial data. Raster databases are organized as an array of cells (pixels) corresponding to particular places on the earth's surface. In a raster system, generally every raster layer corresponds to a single variable for a unit of space (for example, land use at a particular place).

Vector databases correspond to classes of objects that can be represented in the same way (as points, lines, or areas). In a vector system, a point such as a house would be represented by a single ordered pair (x, y), a line such as a river would be represented by a sequence of straight line segments, and an area such as a waste disposal site by the line segments enclosing it.

Computer software systems are identified as raster or vector depending on the main approach taken to storing and processing spatial data. It is possible to represent many spatial phenomena with either data structure and to convert from raster to vector and vice versa.

Sources for Digital Spatial Data

There are both primary and secondary sources for digital spatial data.

Primary sources of positional data rely on direct or indirect measurement of the earth's surface. Surveying and Global Positioning Systems (GPS) involve direct measurement of the surface. Remote sensing involves analysis and interpretation of data gathered by indirect means. Aerial and satellite photographs including digital orthophotographs are examples. Measurements can be taken from these photographs to determine locations for mapping. Digital images can also be compiled from signals from satellites equipped with sensors capable of detecting electromagnetic energy reflected or emitted from objects on the earth's surface. The energy detected is converted into a data value and these data values are enhanced for viewing and subsequent analysis.

Secondary sources of positional data include existing maps and gazetteers. The coordinates of a house, for example, could be estimated by digitizing from an appropriately annotated topographic map. Coordinate locations may a so be published for some objects like cities or schools.

Features of the Digital Spatial Database

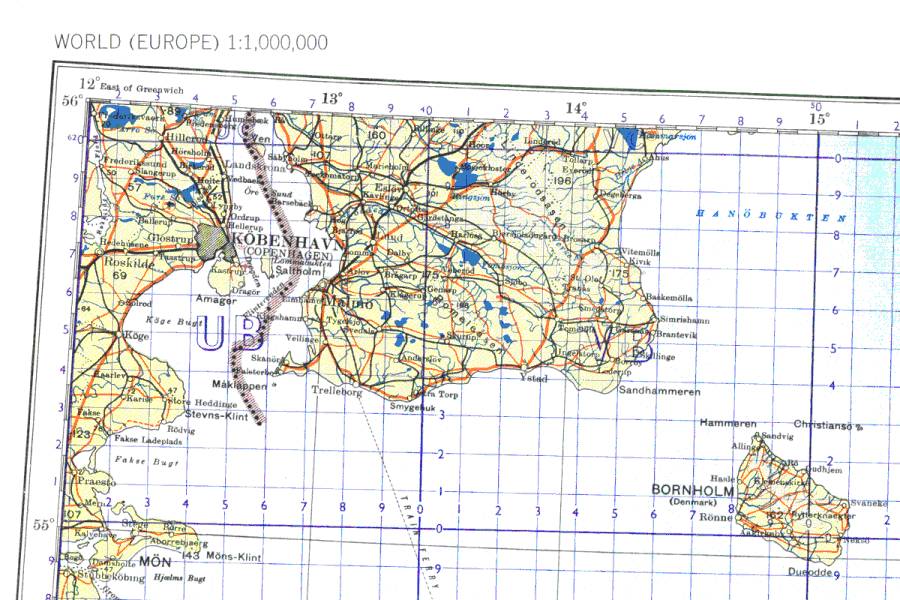
Digital spatial databases that can be used in computer software packages for visualization and mapping store spatial data and share some of the same features as paper maps. Paper maps store many kinds of spatial data in a single sheet, and are used as-is without further processing. Digital spatial database layers, however, generally store only one kind of information or information on only one kind of object. To create a map, the user of the digital spatial databases must use a computer software system to integrate the data layers based on location. If data layers exist in different scales at different projections, the spatial data must be processed further before it can be used.

Scale -- For raster data, the size of a pixel in terms of its area on the earth's surface affects the size of an object that can be discerned in a digital image, thus determining the spatial resolution of the data. A common ground dimension for remote sensing data in the U.S. is 30m x 30m, the pixel size of Landsat Thematic Mapper data. The total region covered by a raster database is defined by the number of rows and columns of pixels in the database.

For vector data, resolution also refers to the smallest feature that can be discerned. The minimum length of a line object, the minimum separation required to display objects as separate and distinct, and the minimum mapping unit size are affected by the scale of the database. The total region covered by a vector database is defined by a bounding polygon within which all of the objects in the database can be placed.

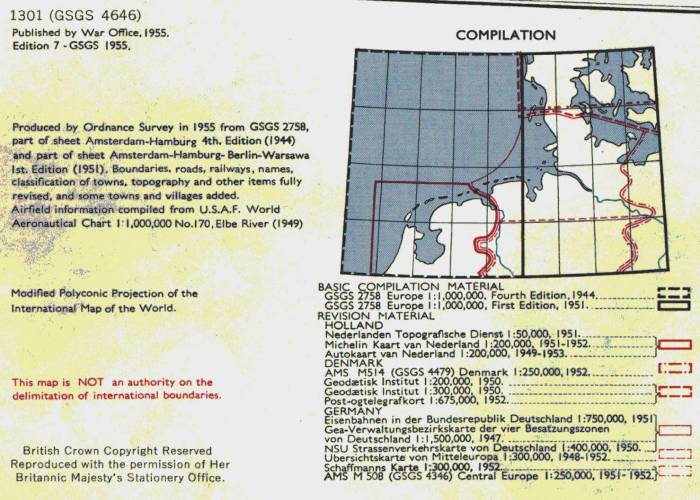
Projection -- Primary sources of positional data usually report locations in latitude/longitude, that is, the spatial data are not projected. For positional information digitized from an existing map, the data are tied to the projection system used to make the original map.

Symbols -- The entity represented in a digital map may be a point, line, or area. Every entity has a number of different attributes. Some attributes are spatial, describing the locations of the entities. Some attributes are graphical (the symbols used by the system to represent the point, line, or area in the visual display). Some attributes are textual/numeric. Others are temporal.
  Spatial  100 Main Street
Graphical  
Textual

Numeric

Jones' House

2000 sq. Feet

Temporal Year Built: 1950 

Unlike paper maps that store attribute information in a given symbolic form, digital spatial databases store objects and attributes. Users of spatial data select graphical symbols from an available set in the particular software package used to view and map the data and can change map classification.

Spatial Data Quality -- Five dimensions of spatial data quality have been identified (lineage, positional accuracy, attribute accuracy, completeness, and logical consistency). Librarians need to understand how to describe spatial databases (metadata) they provide access to so that they can help end users determine whether a particular digital spatial database can meet the needs of the user and what types of processing will be required to get the database to that point.

Suggested Citation

Cromley, Ellen K. "Maps and Digital Spatial Data." Digital Map Librarianship: a working syllabus, 63rd IFLA Conference, Copenhagen, Denmark. (18, Aug. 1997) <http://magic.lib.uconn.edu/ifla/whatis.htm>

Ellen K. Cromley, Ph.D.
Department of Geography, U-148
University of Connecticut
354 Mansfield Road Storrs CT 06269-2148 USA
Phone:(860)486-3656 Fax:(860)486-1348
ecromley@uconnvm.uconn.edu